Visuals
- Max Marcovitch
- Apr 26, 2020
- 1 min read
Updated: Apr 27, 2020
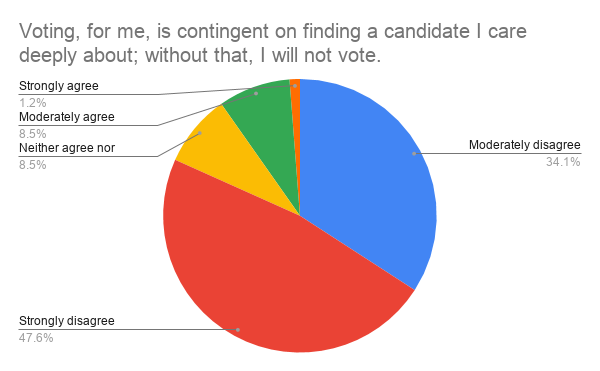
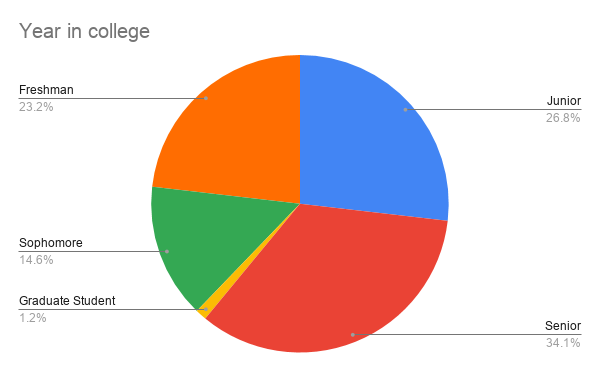
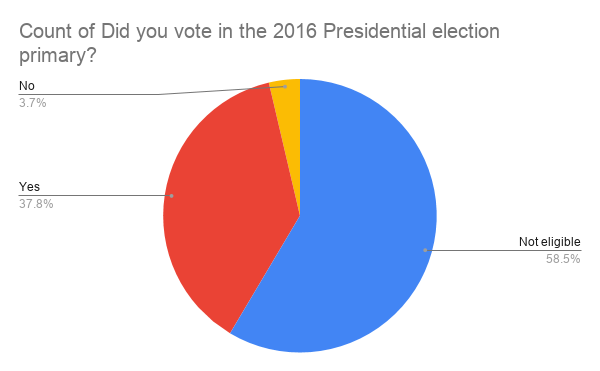
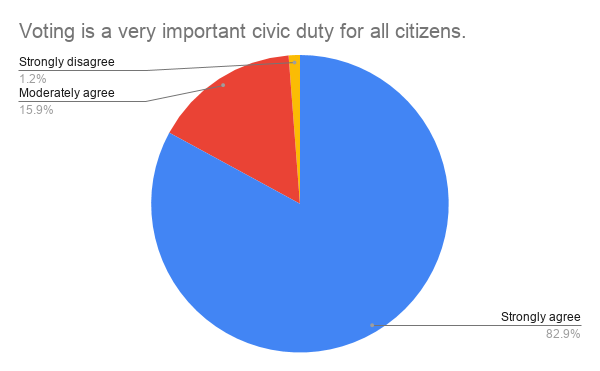
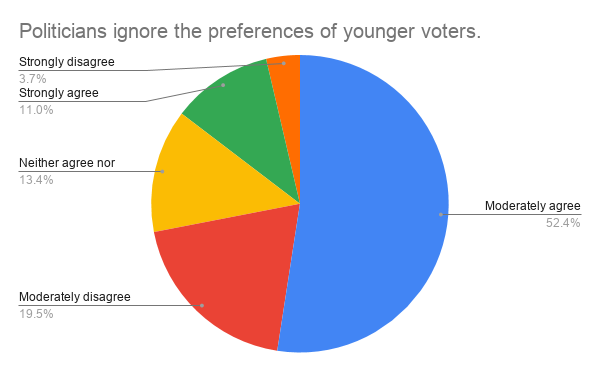
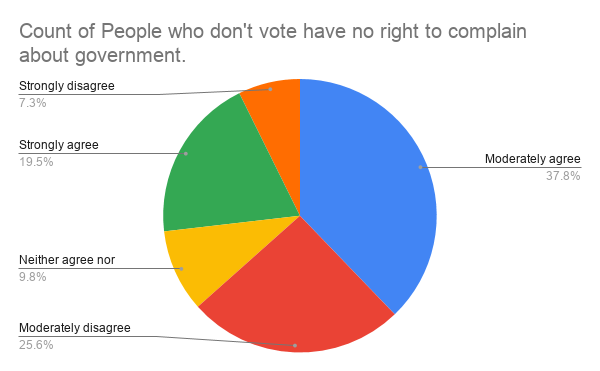
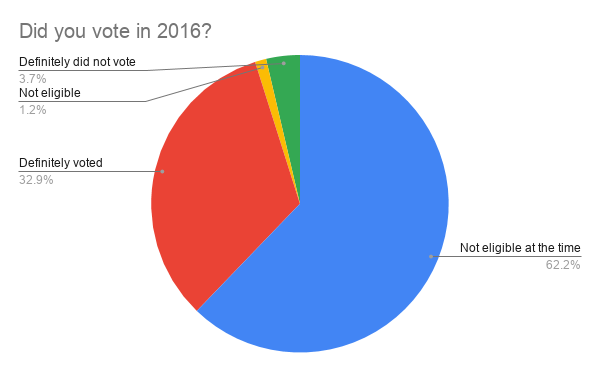
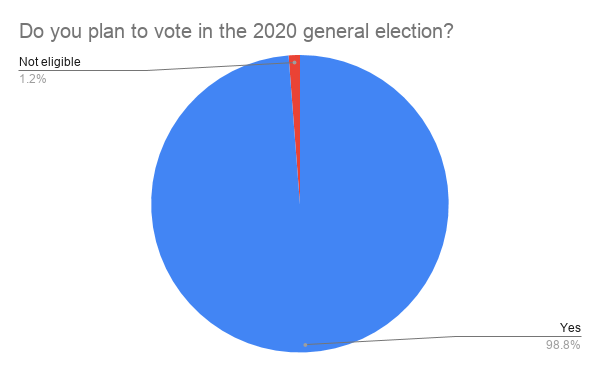
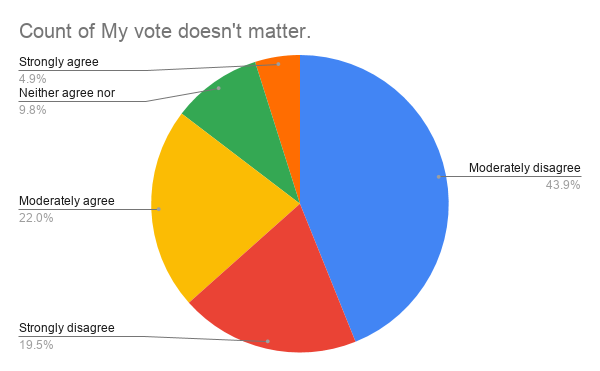
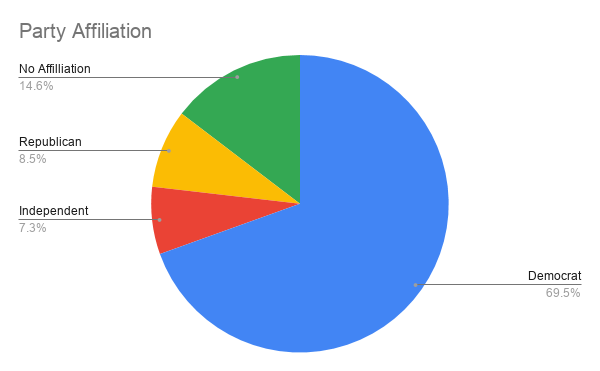
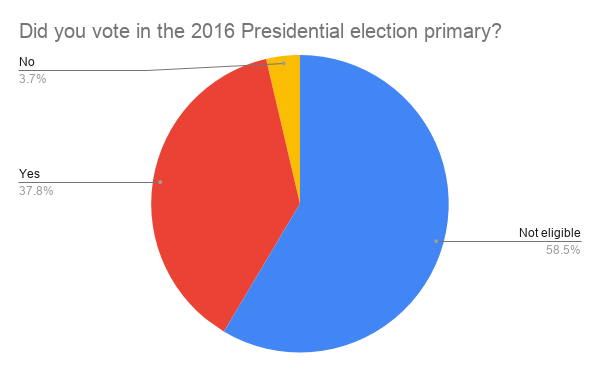
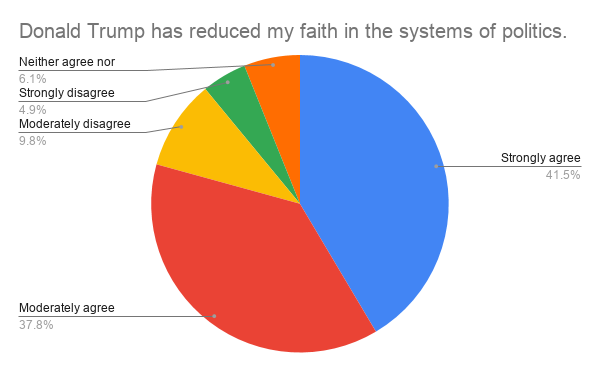
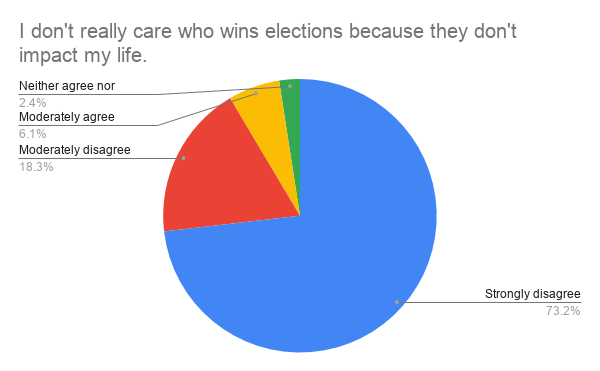
For this project, I randomly administered a 22-question survey to 82 University of Michigan students. Their responses informed the arc of this project, helped me form conclusions I thought I already knew and ones I never expected, and offered a sliver of insight into one of the most confounding questions in American politics. Here are those results, in a visual form:
Graphs:


Linear regressions:

This chart maps the correlation between ideology (from "1", very liberal, to "10", very conservative) and the reduction in one's faith in government as a result of President Donald Trump. You would expect the result, in a hyper-polarized political climate, to be a steep decline along the Y axis. This R-squared linear regression of 0.46, though, indicates a relatively weak correlation between Ideology and Reduction of Faith.

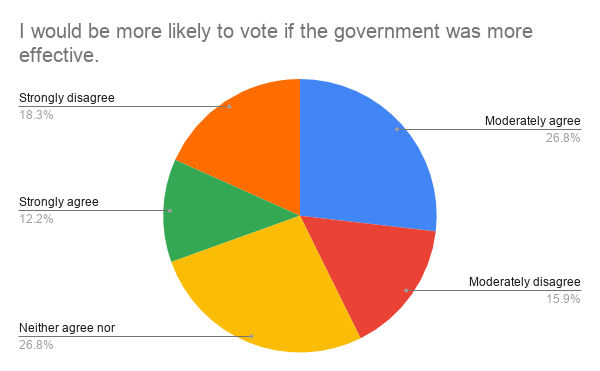
This correlation seeks to get at a more fundamental question: Is the driving force behind low voter turnout a disdain for politicians who don't care about young voters' preferences and still get nothing done? The correlation, as shown by the R-Squared between Youth Preferences and Government Effective is 0.773, indicating a relatively substantial correlation between those who believe politicians ignore the preferences of youth and said they would be more inclined to vote if government were more effective.


Comments